Model Description
This is a demonstration that helps students visualize the effects of fluid pressure on various surfaces. Various cutout shapes are used, including plane and curved surfaces, which are submerged into a fish tank during the derivation of the hydrostatic pressure equation. This demonstration should take 8-10 minutes.
Engineering Principle
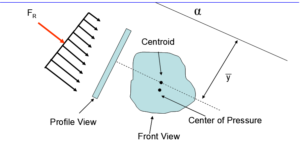
Hydrostatic forces acting on a submerged plane surface are linearly distributed over the surface, and act at the center of pressure rather than the centroid of the object. Most textbooks include a picture similar to the figure below, which is a view looking down upon an object placed into the fluid at an angle. The geometry and orientation is often hard for students to grasp, so this demonstration makes it easier for them to conceptualize. Below is a hydrostatic pressure distribution.
Calculating the magnitude of the resultant force is straightforward using the hydrostatic pressure equation.

where:


A = Object’s surface area
Finding the location of the resultant force is more difficult, but is done using the equation

where:


The difficulty with the derivation comes in differentiating between the various geometry measurements: 
What You Need
| Item | Quantity | Description/Clarification |
|---|---|---|
|
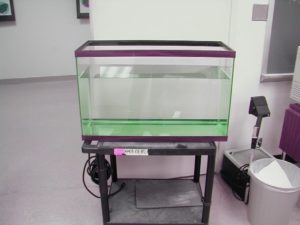
Fish tank |
1 |
It must be large enough to fit in the cutouts. |
|
Plastic cutouts representing plane and curved surfaces |
Various |
Use different shapes and sizes. Ideally, one cutout is shaped like the object in the drawing/figure used during the derivation (like above). |
How It’s Done
Before Class: Fill the fish tank and have it on a rolling cart if possible. This will enable it to be placed in a prominent position during the actual demonstration.
In Class: When doing the derivation and discussing the differences between 
Next, discuss the difference between the various measurements. The “y” distances are slant lengths, and run along the surface of the object, whereas the “h” measurements are vertical distances from the water surface.
Observations: Students can visualize the pressure distribution along a submerged surface and see the difference between the various geometric measurements associated with hydrostatics.
Instructor Tips: The curved surface cut outs can also be used to demonstrate the projected area of a section of fluid when dealing with submerged curved surfaces. Additionally, they help in visualizing the “cut out” section when calculating its volume.